Aluminum cylinder tubes are cylindrical components made of aluminum alloy materials. With characteristics such as lightweight, high strength, and durability, they have become key components in mechanical manufacturing and industrial equipment. Their wide applicability covers multiple fields including hydraulic systems, pneumatic tools, and heat dissipation devices. This article will systematically elaborate on the technical characteristics, application directions, and selection strategies of aluminum cylinder tubes, providing practical references for users.
I. Core Advantages of Aluminum Cylinder Tubes
1. Lightweight and High Strength
The density of aluminum alloy is only 1/3 that of steel, but after alloying treatment, its tensile strength can reach over 300MPa. This characteristic is particularly important in scenarios requiring weight reduction, such as automotive manufacturing and aerospace fields, where aluminum cylinder tubes can significantly reduce equipment weight and improve energy efficiency.
2. Excellent Thermal Conductivity
The thermal conductivity of aluminum is approximately 237W/(m·K), far exceeding that of most metal materials. This makes aluminum cylinder tubes the preferred choice in equipment requiring rapid heat conduction, such as radiators and engine cooling systems, effectively preventing component deformation caused by thermal stress.
3. Corrosion Resistance
The surface of aluminum alloy can naturally form an aluminum oxide protective layer, maintaining structural stability even in humid, acid, or alkaline environments. Through surface treatment processes such as anodization, its corrosion resistance can be further enhanced, extending service life.
4. Flexible Machinability
Aluminum alloy can be formed through casting, extrusion, and other methods to meet complex structural requirements. Subsequent machining processes such as turning and drilling can ensure dimensional accuracy, satisfying the assembly requirements of high-specification equipment.
II. Analysis of Mainstream Application Fields
1. Hydraulic and Pneumatic Systems
As core components of hydraulic cylinders and pneumatic cylinders, aluminum cylinder tubes perform power transmission functions in construction machinery (e.g., excavator hydraulic arms) and pneumatic devices in automated production lines. Their lightweight design can reduce system inertia and improve response speed.
2. Thermal Management Scenarios
In cooling systems such as automotive radiators and air-conditioning condensers, aluminum cylinder tubes accelerate heat exchange high thermal conductivity. The high requirements for heat dissipation efficiency in the new energy vehicle field further promote their application in this scenario.
3. Industrial Machinery Support Structures
Aluminum cylinder tubes can serve as guide rails, brackets, and other components, providing stable support for precision instruments and equipment. Their low-density characteristic facilitates lightweight transformation of mechanical structures.
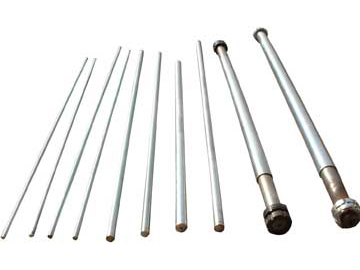
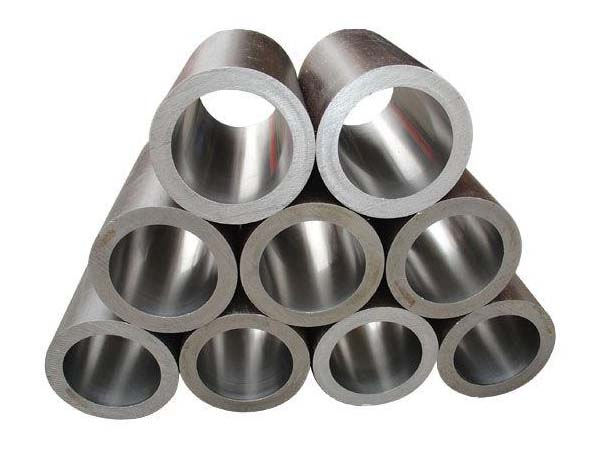
III. Manufacturing Processes and Technical Key Points
1. Selection of Forming Processes
– Extrusion Method: Suitable for long pipes with regular cross-sections, enabling continuous production and controllable costs.
– Precision Casting: Suitable for complex shaped parts, formed through sand casting or die-casting technology to reduce subsequent processing volume.
2. Surface Strengthening Treatment
Processes such as anodization and hard anodization can form a hardened layer of 10-30μm, increasing wear resistance by more than 3 times; epoxy resin coating is applicable to high-temperature and high-humidity environments to prevent chemical corrosion.
3. Precision Control Standards
The diameter tolerance of high-precision aluminum cylinder tubes should be controlled within ±0.05mm, and the straightness deviation should not exceed 0.1mm/m, ensuring matching accuracy with pistons and seals.
IV. Scientific Selection and Usage Recommendations
1. Material Adaptation Principles
– 6061 Aluminum Alloy: Suitable for hydraulic systems in conventional environments, balancing strength and cost.
– 7075 Aluminum Alloy: Applicable to high-strength scenarios such as aerospace and military industries, with tensile strength exceeding 500MPa.
2. Working Condition Matching Strategies
High-load equipment should select cylinder tubes with wall thickness ≥8mm; high-temperature environments recommend nickel plating or ceramic coating processes; scenarios with frequent movement should prioritize surface hardening treatment.
3. Supplier Screening Criteria
Key factors to consider when evaluating manufacturers include: industry certification qualifications such as IATF 16949 or AS9100, third-party testing reports (e.g., salt spray test data), customized design capabilities, and after-sales response efficiency.
As the global manufacturing industry transforms towards high efficiency and energy conservation, the penetration rate of aluminum cylinder tubes in emerging fields such as new energy vehicles and intelligent equipment will continue to increase. Mastering their technical characteristics and making reasonable selections will provide strong support for enterprises to optimize equipment performance and reduce maintenance costs.